Whether you are trying to figure out why your array has 3 objects instead of 5 or why your game plays backward since the new guy started, debugging is an essential part of the development process. At the end of this article, you’ll have an understanding of the most important debugging facilities available to you and how to use them to help squash your bugs in less time.
We will be covering how to:
- Inspect your applications state using the console
- Perform logging, and move beyond NSLog
- Track memory usage by following object life-cycles
Inspection Using the Console
That little black box at the bottom of Xcode should be your best friend when it comes to debugging. It outputs log messages, error messages and all sorts of other useful things that will help you track errors down. In addition to reading output directly from the log, we can also stop at a given point in our program and inspect various parts of our application.
Breaking Conditionally
I’m going to assume that you know how breakpoints work (and if you don’t, not to worry, you’ll pick it up by the end of this!). Breakpoints are invaluable in seeing where our application is at a given point in time, but it can be a pain to step through a loop or recursive function after triggering a breakpoint until our object equals a certain value. Enter conditional breakpoints!
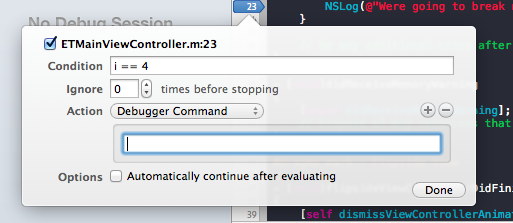
Conditional breakpoints are breakpoints that will only break when a certain condition is met. Imagine that we only want to break when an object is in a certain state, or on the ‘nth’ iteration of a loop. Add a breakpoint to your code by clicking on the ‘gutter’ of the Xcode editor, right click on the breakpoint, and then select ‘edit breakpoint’ to set special conditions.

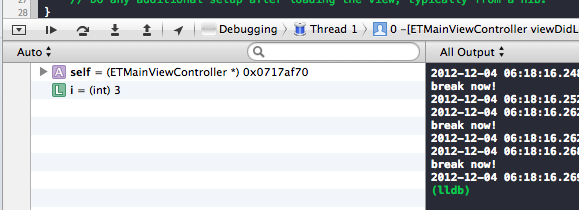
You can provide a condition (eg. i == 12) or the number of times the breakpoint should be ignored. You can also add actions that occur automatically upon the break, for example a debugger command that prints a value.
Tip: The keyboard shortcut for adding/removing a breakpoint is command+\Another important breakpoint trick to implement is adding the ‘exception breakpoint’. Ever noticed that 99% of the time when we hit an exception, Xcode takes us to the autorelease pool in our main method?
By setting an exception breakpoint, you can go the exact line of code that caused the exception with a breakpoint. To do so, open the exceptions breakpoint tab (command+6). At the bottom left of the window, there is a “+” button. Select this to add an ‘exception breakpoint’. Now when Xcode encounters an exception, it will break where in the code it occurred.
Manually Printing From the Console
If we have broken at a specific point in our app generally speaking it’s because we want to see what state our objects are in. Xcode provides us the ‘variables view’ which is that view at the bottom of Xcode next to the console. In theory it displays the current state of all the values relevant in the current context. In practice, this sometimes proves to be a little buggy. Sometimes it won’t list values or not update them when you step through.

Luckily, we can inspect specific objects ourselves using some very useful console commands. Typing ‘po’ into the console allows us to get instant detail about a given object (when dealing with scalar values we use ‘p’).

This can be useful for seeing if an object already exists (this will print nil if it does not), determining the value of an object, finding out what an array/dictionary contains at run-time, and even comparing two objects. Because this command prints out the memory address of the relevant object, you can print out two objects that you think should be the same and see if they have the same memory address to be sure.
Another useful but hidden command that you can use to easily inspect your views is the recursiveDescription command. Call this on a view to get a print out of its view hierarchy.

Effective Logging
There are certain times when debugging our program we want to log a certain message to the console. The ‘NSLog’ function allows us to print any output we want to the console. This can be important if we want to follow certain pathways through our application or test what a value equals without having to explicitly place break points at every possible line. NSLog follows the same format as [NSString StringWithFormat] method (as you can see in the below shortcut).
Tip: New to formatting strings in Objective-C? Check out Apples String Programming GuideGetting Smart With NSLog
While NSLog is useful, we need to be smart about how we implement it. Anything that is printed out from NSLog goes into production code, and is therefore visible to anyone. If someone was to plug the device into the organiser and look at the console, they could see every single log message. As you can imagine, that could have some serious implications! Imagine if you printed out some secret algorithm logic or the user’s password to the console! Because of this, apps will sometimes get rejected if Apple detects too much output to the console in a production build.
Luckily, there is a better way to do logging. Depending on how much effort you want to put in, there are several ways to go about this. Perhaps the easiest way is to use a macro that only includes NSLog in debug builds. Including this in a globally accessible header file means you can put as many logs as you like into your code or none of it will enter production (provided you don’t modify the default pre-processor macro values, and if you don’t know what those are, don’t worry).
#ifdef DEBUG
#define DMLog(...) NSLog(@"%s %@", __PRETTY_FUNCTION__, [NSString stringWithFormat:__VA_ARGS__])
#else
#define DMLog(...) do { } while (0)
Now if you use DMLog (or whatever you choose to call yours) it will only print this out during a debug build. Any production builds will do nothing. __PRETTY_FUNCTION__ also helps out by printing the name of the function that the logging is coming from.
Taking the Next Step
While NSLog is great, it has a number of limitions:
- It only prints locally
- You cannot give a log a ‘level’. (For example critical, warning, all, etc)
- NSLog is slow. It can slow down your program dramatically when performing a large amount of processing
For those that want to get hardcore about logging, there are frameworks out there that overcome some or all of these limitions depending on how much effort you want to put in. I’d recommend looking at the following tools:
- Cocoa LumberJack – One of the well known and versatile logging frameworks for Cocoa. A bit of a learning curve but it is very powerful
- SNLog – A drop in replacement for NSLog
Following Object Life-Cycles
Although the introduction of Automatic Reference Counting (ARC) has ensured that memory management is not the massive time vampire it used to be, it is still important to track important events in our object’s life-cycles. After all, ARC does not eliminate the possibility of memory leaks or trying to access a released object (it simply makes this harder to do). To this end, we can implement a number of processes and tools to help us keep an eye on what our objects are doing.
Logging important events
The two most important methods in an Objective-C object’s life-cycle are the init and dealloc methods. It’s a great idea to log these events to your console so you can watch when your objects come to life and, more importantly, make sure they go away when they are supposed to.
- (id)init
{
    self = [super init];
    if (self)
    {
        NSLog(@"%@: %@", NSStringFromSelector(_cmd), self);
    }
    return self;
}
- (void)dealloc
{
    NSLog(@"%@: %@", NSStringFromSelector(_cmd), self);
}
While typing this code might seem tedious to start off, there are ways to automate the process and make this easier. I can guarantee it will come in handy when your application behaves in ways it shouldn’t. You can also utilize a few tricks you learned in the logging section so this isn’t printed out in a production build (or even better, create a macro for it yourself!).
The Static Analyzer and the Inspector
There are two tools that come with Xcode that we can use to clean up our code and make our code less error prone. The Static Analyzer tool is a nifty way for Xcode to recommend improvements to our code, from unused objects to potentially under or over released objects (still an issue on ARC for Core Foundation objects). To see these recommendations, go to Product and select ‘Anlayze’.
The inspector is a powerful tool that allows us to closely ‘inspect’ various aspects of our application to do with memory usage, activity on the file system, and it even provides ways to automate UI interaction. To ‘inspect’ your application select ‘Profile’ in the ‘Product’ drop down menu.
This will open up the Instruments window where you can select a profile template to run. The most common ones to run are zombies (we’ll discuss this later), activity monitor, and leaks. Leaks is perhaps the most useful template to run to hunt down any memory leaks that may be present in your application.
Zombies Are Your Friend
Although it is much harder to run into the dreaded EXC_BAD_ACCESS error now that ARC is in place, it can still happen under certain circumstances. When dealing with UIPopoverController or core foundation objects, we can still attempt to access an over released object. Normally, when we release an object in memory it is gone forever. However, when Zombies are enabled, the object is only marked as released but stays around in memory. That way when we access a Zombie object, Xcode can let us know that you tried to access an object that normally wouldn’t be there. Because it still knows what it is, it can let you know where and when it happened.
You can hunt down Zombies using two methods. Either by using the inspector and running a Zombie profile template, or by enabling it as a diagnostic option within the ‘Run’ build option. Right next to the stop button, click the scheme name, then click ‘Edit Scheme’ and under run click the diagnostic tab and select ‘Enable Zombie Objects’. Note that debugging in Zombie mode is only available when debugging in the simulator, you cannot do it on an actual device.
Conclusion
Hopefully the above gave you a few insights into how to debug your applications more effectively. It’s all about finding ways to reduce time spent bug fixing so we can spend more time doing what’s important, building great apps!
This is by no means a comprehensive list. There are many other techniques that haven’t been discussed here such as debugging issues in production, remote bug reporting, crash reporting, and more. Do you have a technique that you want to share? Maybe you’ve got a question related to one the above points? Post it below in the comments!
Happy Programming!


